Obviously, the nominal dollar cost of a house or a condo today is much higher than it was 20 or 30 years ago. Indeed, it’s even higher than what it was just a couple of years ago. While a number of indices look at the price of housing by deflating the nominal dollar price of a house by the consumer price index (CPI) to measure the rate at which housing prices are rising relative to the general rise in prices of consumer goods, I wish to measure the changes in housing prices in terms of how many weeks of labor time, paid at the US median weekly rate, it takes to purchase an average residential property.
This is a pretty simple exercise: all that needs to be done is to divide the average selling price of a property by the median weekly wage. The result, from 1970 to 2015, is shown in Figure 1 below.
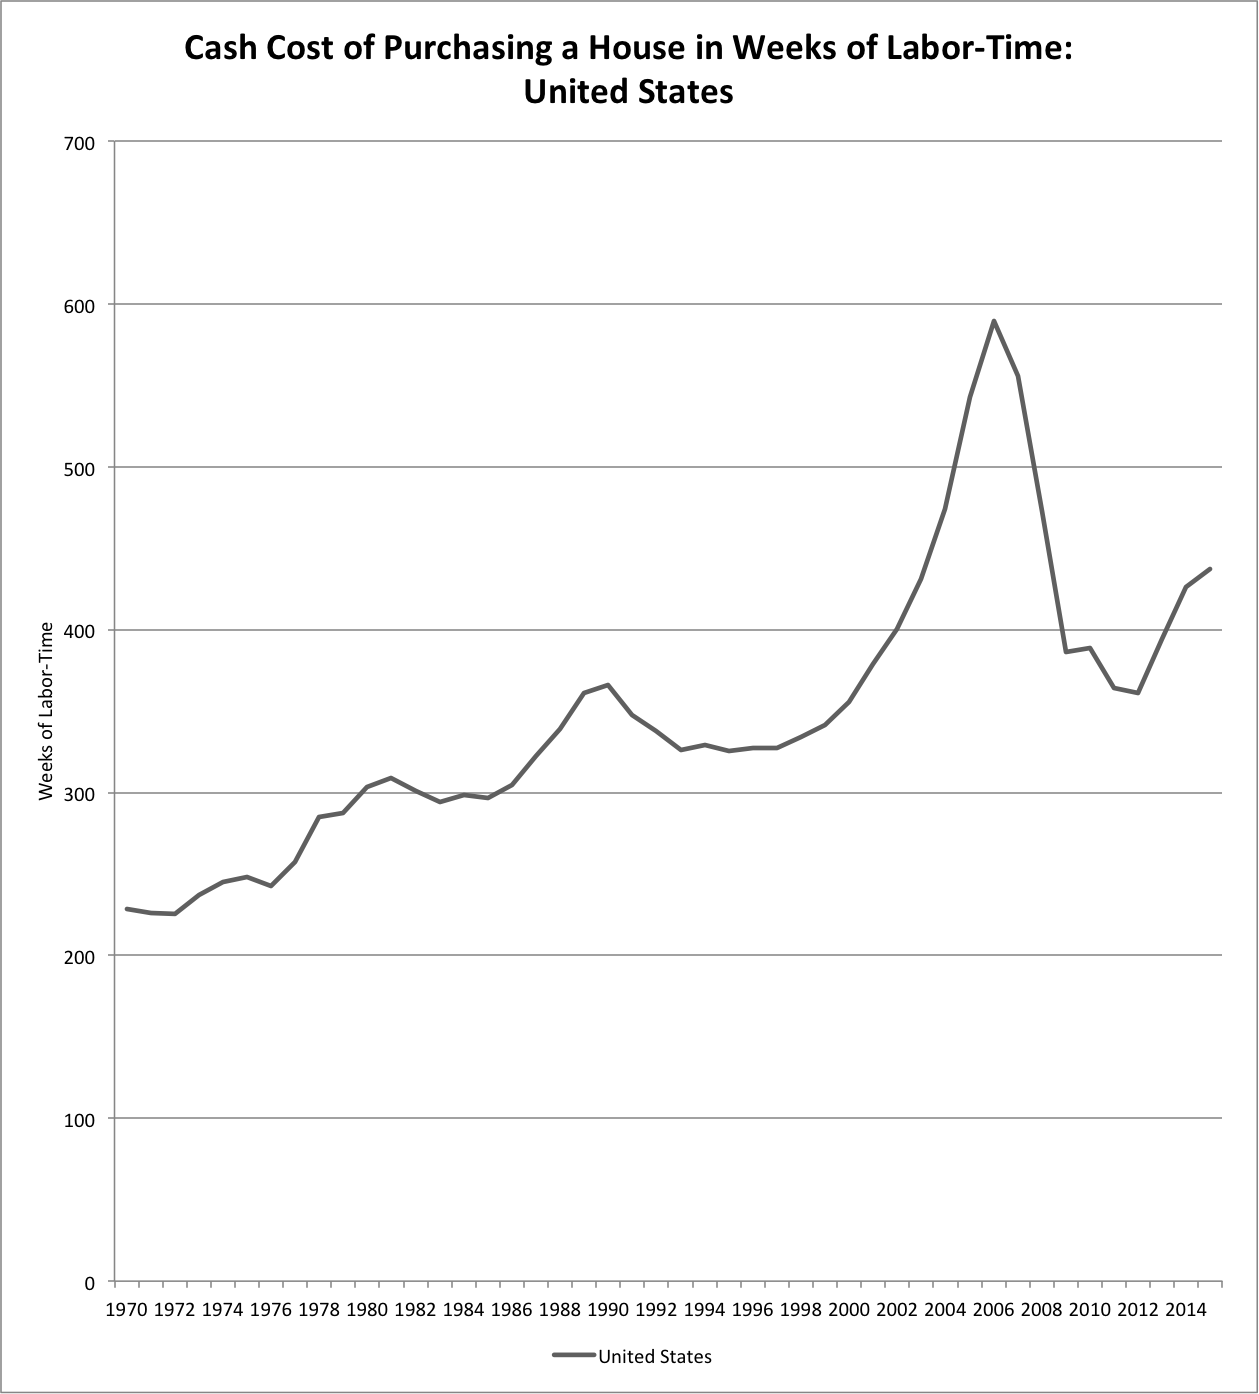
The figure shows clearly that the cash cost of a residential property in terms of weeks of labor time has changed considerably through a series of cycles. The cost rose slowly but continuously between 1972 and 1981, despite the two oil shocks of 1973 and 1979. The anti-inflation policies and the brisk increase in interest rates that the Fed under Paul Volcker had imposed on the American economy in 1980 and 1981 (and subsequently on the rest of the world) brought on stagnation in housing prices by measure of weeks of labor time from 1981 to 1986. This was followed by another period of rising costs, from 1986 to 1990. Housing prices then declined slightly and did not return to their 1990 level until 2000, despite the Clinton boom years. The low interest rates that the Fed granted to compensate for the 9/11 attack and the stock market debacle of 2000 and 2001, as well as the financialization of the economy and the deregulation of the financial sector, then led to the extraordinary increase in the cash cost of residential properties from 2000 to 2006, as can be readily seen in Figure 1. The fall in the dollar price of houses from 2006 to 2012 was mirrored by its fall in terms of weeks of labor time, bringing the cost in 2012 back to its value of the early 1990s. Finally, housing prices recovered from 2012 to 2015, so that in terms of weeks of labor the 2015 price is no different from what it was 12 years earlier.
The cash cost measured by of weeks of labor time of a residential property in 2015 is approximately twice as high as what it had been in the golden years of the early 1970s. Similarly, when that cost reached its apex in 2006, it was also approximately twice the cost in terms of weeks of labor time that buyers had to face in the first half of the 1980s.
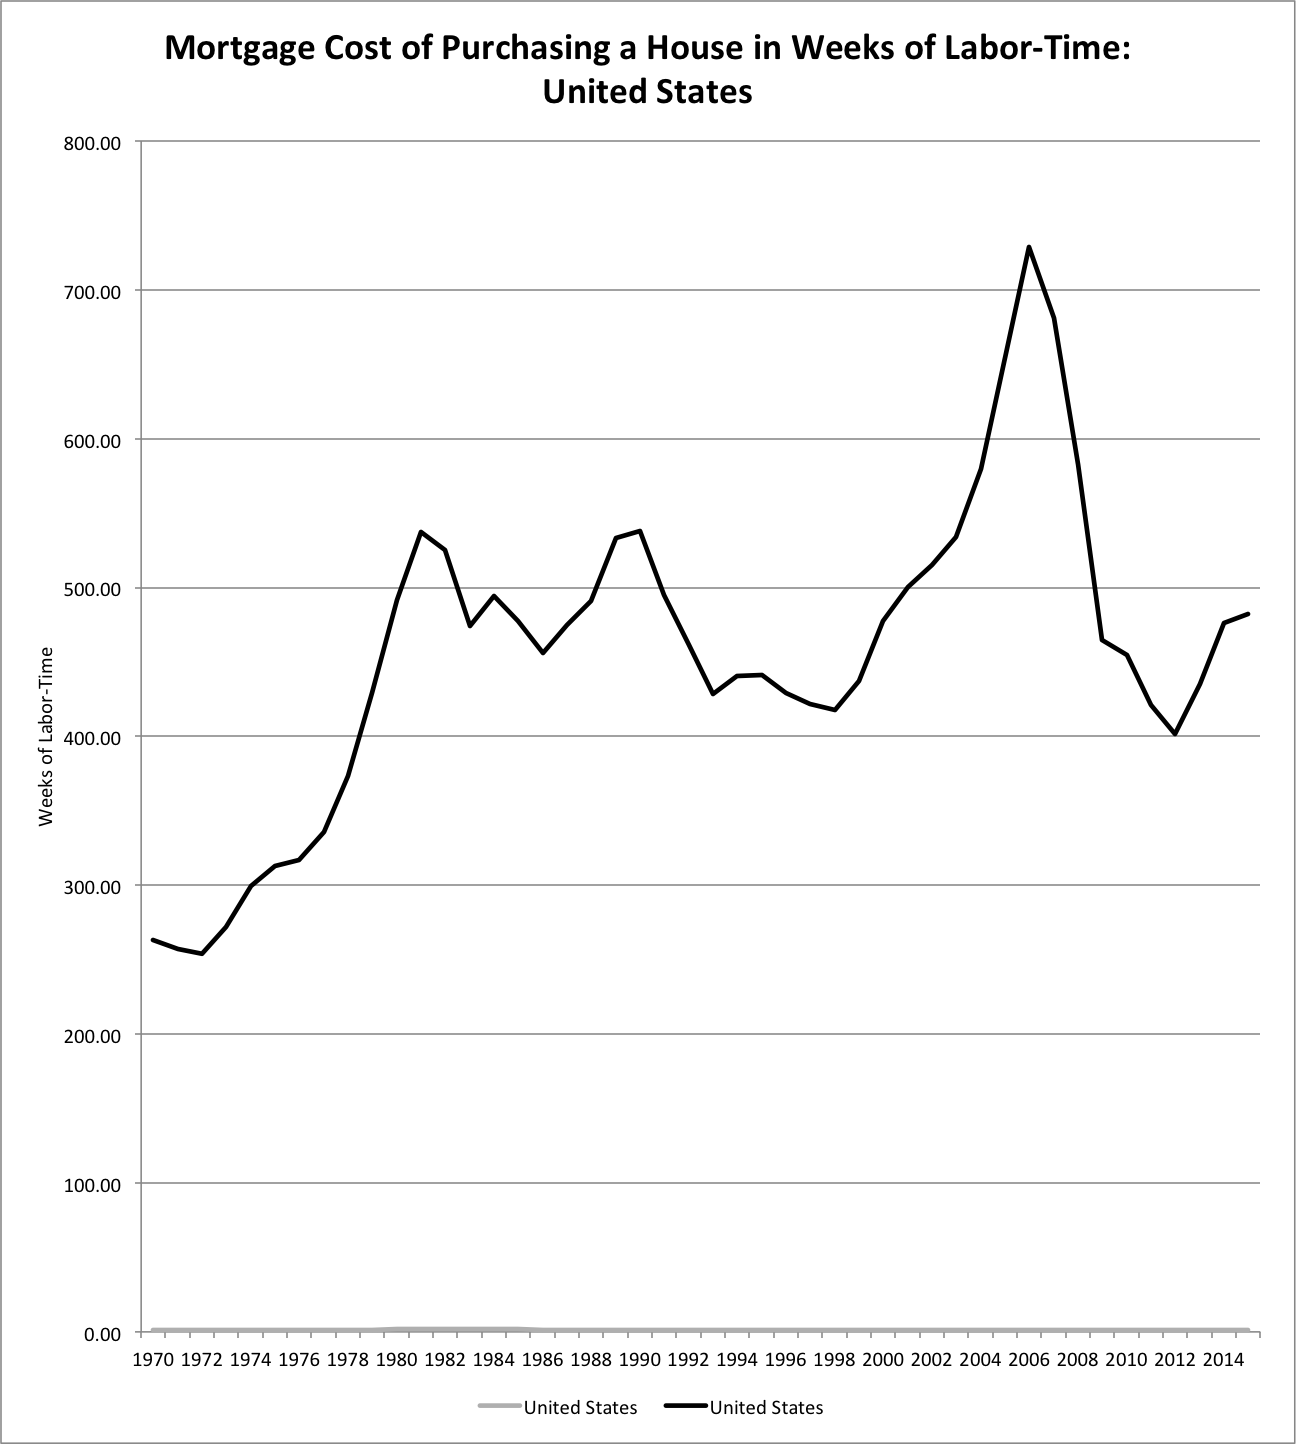
Most home buyers, unless they inherited wealth from their parents, are unable to pay cash for their properties, so it is more interesting to assess how much it costs Americans in terms of weeks of labor time to purchase the average residential property when the buy requires a mortgage. This is shown in Figure 2. Obviously, different purchasers have financed their property through a variety of schemes, too numerous to be considered here. For ease of computation, the numbers are based on some simplifying and arbitrary assumptions. I assume that the whole value of the dwelling is financed through a series of three five-year fixed mortgages, amortized over 15 years and based on the nonjumbo fixed rate on 15-year home mortgage loans. Of course, since we don’t know what interest rates and wage rates will be after 2016, the numbers for the years after 2011 are estimates based on an extrapolation of recent numbers for these two variables (with a return towards trend values in the case of interest rates).
The evolution of the mortgage cost of purchasing a residential property in terms of weeks of labor shows some similarities but also some differences with the evolution of the cash cost, as seen by comparing Figures 1 and 2. The mortgage cost of purchasing a house in the 1980s was already twice as high as buying and financing the average property in the early 1970s, and the 1990s saw a substantial decrease in the mortgage cost of purchasing a property. Subsequently, the mortgage cost, just like the cash cost, went through an extraordinary increase in terms of weeks of labor time, moving from 418 weeks in 1998 all the way to 729 weeks in 2006. Indeed, on the verge of the subprime financial crisis, the mortgage cost of an average property was three times the mortgage cost of an average property of the early 1970s. No wonder so many new buyers were forced to default on their mortgage loans! By 2012, however, the mortgage cost was similar to the one that existed in 1998 as well as in 1979, just before the Volcker interest rate shock took effect. Still, in 2015 the mortgage cost of purchasing the average property is estimated to be twice as high as the mortgage cost of the early 1970s.
The impact of mortgage interest rates can be further assessed by Figure 3, which measures the evolution of the mortgage to cash cost ratio of purchasing a residential property in terms of labor time. Looking for instance at the situation of someone buying a house in 1986, the mortgage rate in 1986 obviously has an enormous impact on this ratio, but since under the assumptions outlined earlier the mortgage needs to be renewed in 1991 and 1996, the mortgage rates in these two years will also play a role.
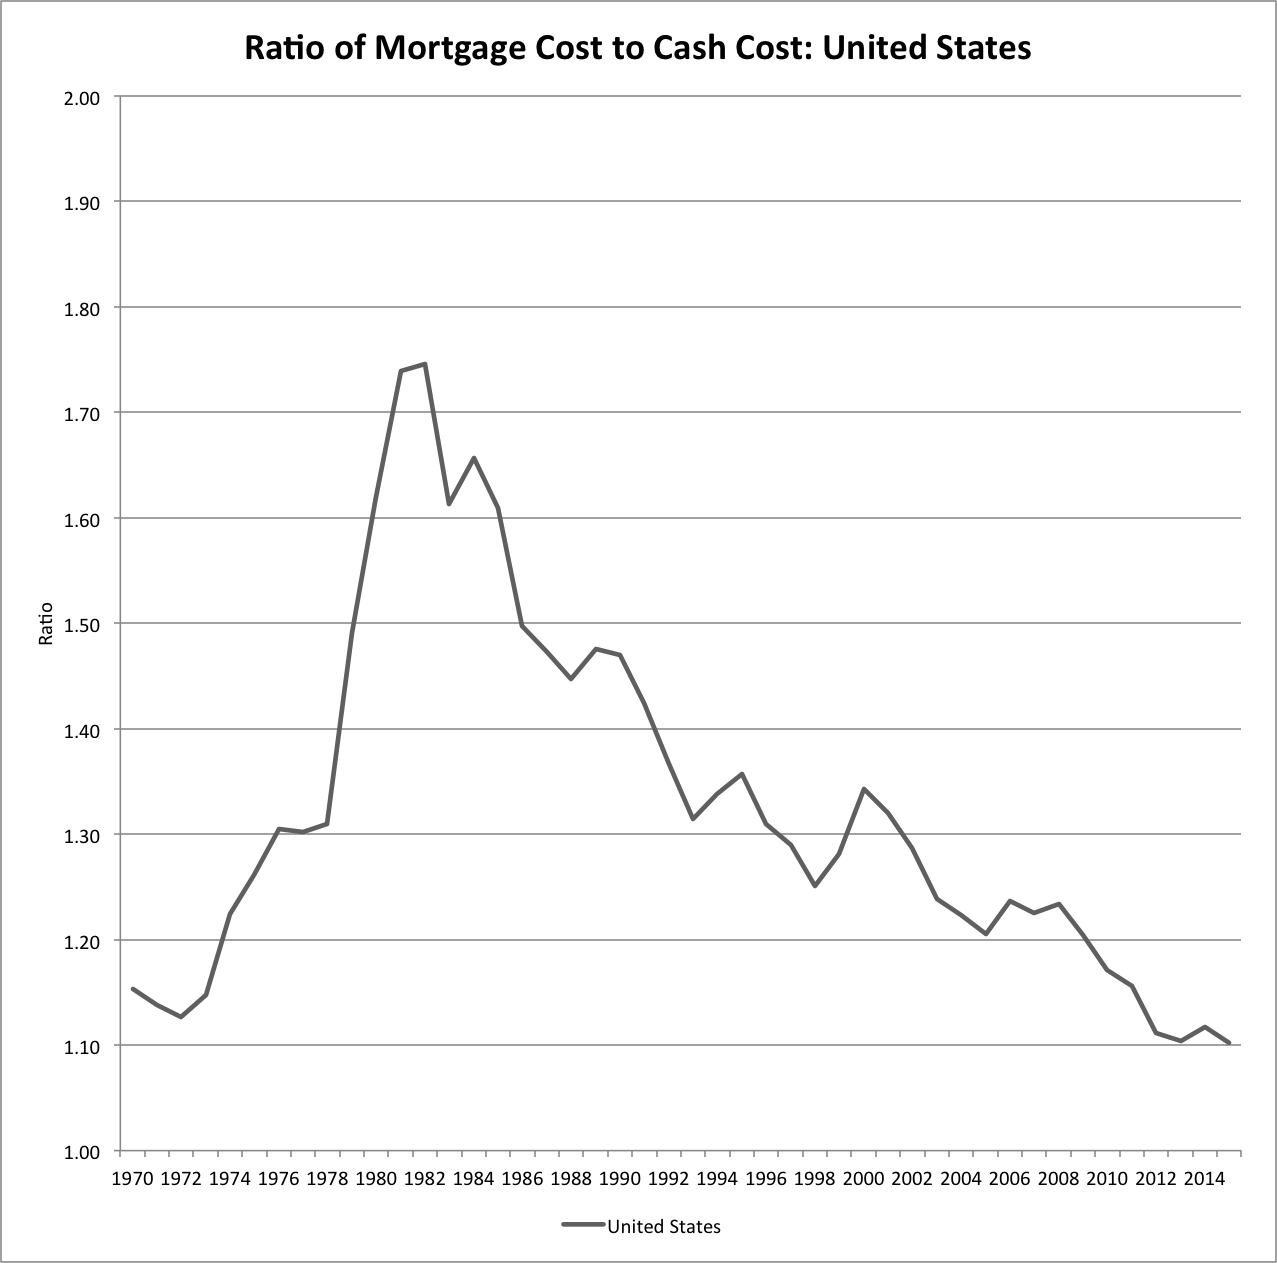
In a fair world, one would expect the cash cost and the mortgage cost in terms of weeks of labor time to be the same, and hence the ratio described in Figure 3 to be equal to unity. However, this happens only in the early 1970s, although there is a tendency to get back there in the 2010s. (Remember that from 2012 on, the interest rate at renewal time is based on a forecast, as is the growth in weekly wages, so the actual data stops in 2011). The reason fairness would require that this ratio be equal to 1 is that, as argued by the Italian economist Luigi Pasinetti in his well-known 1981 book, Structural Change and Economic Growth: A Theoretical Essay on the Dynamics of the Wealth of Nations, a fair interest rate is such that the purchasing power of one hour of labor stays constant through time, even when its monetary equivalent is lent or borrowed. This occurs when the nominal interest rate is equal to the growth rate of nominal wages.
Thus, a fair mortgage rate is such that the cash cost and the mortgage cost of purchasing a house is the same in terms of weeks of labor time. Mortgage rates are currently very low by historical standards, not only in nominal and real terms but also in terms of the growth rate of nominal wages, as shown by Figure 3, but they would need to be even lower to fulfill the standard of fair rates and achieve a unity ratio. Pro-growth fiscal policies that could eventually lead to faster growth in wages, without interest rate increases, would further help in bringing mortgage costs towards cash costs, which is something that is not unthinkable today since central bankers are now more aware of the long-term negative consequences that their short-term inflation targeting policies may inflict.
While some fairness has nearly been achieved in terms of the mortgage rates being charged to house purchasers, there still remains the fact that buying an average residential property today requires about twice as many weeks of work paid at the median wage rate than it did 40 years ago, when the United States was still considered a land of opportunity and of social mobility. From this standpoint, there is no inter-temporal or inter-generational equity. This conclusion could however be questioned by some observers, by arguing that most of the cost increase in residential units could be attributed to the desire of households to acquire ever bigger houses. For instance, newly-built houses in 1973 had on average 1660 square feet; in 2014 they had 2680 square feet. Assuming that the price of a newly-built house is the same as that of an average house (obviously a doubtful assumption), this would imply that in 1973 the cash cost of one hundred square foot of housing required 14.4 weeks of labor time; in 2014, the cash cost of one hundred square foot of housing required 15.8 weeks of labor time, only about 10 per cent more than in 1973! Therefore, whether current households suffer from an inter-generational inequity depends on whether one believes that the average size of houses is a free individual choice or whether one believes that, at least to some extent, it is being imposed by the construction industry and society as a whole.
This research was financed by a grant that Mario Seccareccia and I obtained from the Institute for New Economic Thinking (INET). Many thanks to our research assistants Najib Khan and Drew Penner.