In the last couple of months, Greece has once again become the center of attention of politicians, academics, and the general public. The debate has, for a large part, focused on Greece’s fiscal deficit as if it were just a self-inflicted Greek problem. But is it? The debt problem is in fact not unique to Greece. Cyprus, Ireland, Portugal, and Spain have also had their own sovereign debt crises and received bailout packages to avert defaults. While Ireland, Portugal, and Spain exited their bailouts and Cyprus announced that it intends to exit its bailout in 2015, their debt problems are still lingering, with debt/GDP ratios at about 100 percent or more. It is not just these bailout countries that are debt-ridden. We could also add Belgium, France, and Italy to the list. What is the scope of this crisis?
We cannot compare the Euro crisis to the crises in the 1990s in Asia, Latin America, Russia, and Turkey. The Euro crisis erupted in the aftermath of the financial panic in the United States in 2008, with international capital markets collapsing and the world economy coming to a standstill. In contrast, the crises of the 1990s erupted in the midst of highly liquid international capital markets with a healthy financial center and a growing world economy, with vulnerabilities only present in the crisis countries. Crises triggered by a meltdown in the financial center are different, but, what are the characteristics of these crises? And how do they differ from crises erupting from just home-grown problems?
Financial center panics are rare disasters, so in order to assess the scope of the current crisis we need to look at a longer historical episode. But not just any episode: since financial center crises come on the heels of international capital flow bonanzas, we should look back to the first episode of financial globalization in the 19th and early 20th centuries. My recent paper, “Systemic and Idiosyncratic Sovereign Debt Crises,” with Pablo Vega-Garcia, examines sovereign defaults from 1820 to 1931 with a focus on Latin America. We identify these two varieties of crises and study their origins as well as their resolutions.
During this episode of more than one hundred years, there were sixty-seven defaults. Interestingly, 63% of the crises were systemic, with at least one third of the countries defaulting together. These defaults were clustered around a crisis in the financial center, such as the London panic in 1825, the crash of the Vienna Stock Market in 1873, the near-collapse of Baring Brothers (a major underwriter of Latin America and European government debt) in London in 1890, and, of course, the financial panics in 1929 in London and New York. The remaining 37% of the crises are idiosyncratic, isolated events triggered by just adverse shocks to the domestic economy.
Figure 1 portrays the evolution of international liquidity relative to its average during the 19th and early 20th centuries, zooming in on the 10 years around the year of the onset of both systemic and idiosyncratic crises. Systemic crises erupt following a massive increase in international liquidity going bust, or more specifically, in the midst of a 14 percentage-point decline of international liquidity. In contrast, idiosyncratic crises occur even when the degree of international liquidity is similar to the average liquidity observed during our more than one hundred year episode.
Importantly, the panics in the financial center and the disruption of capital markets fuel sharp economic contractions in the world economy as well as episodes of deflation, making it more difficult for debtor countries to repay their debt. To capture both sluggish real growth and deflation around the beginning of both types of crises, Figure 2 shows the evolution of the growth rate of nominal world economic activity relative to its average during the first episode of financial globalization in the 19th and early 20th centuries. Systemic crises occur in the midst of a sharp slowdown of 11 percentage-points, but during idiosyncratic crises growth continues at rates similar to the average.
The panics in the financial centers also lead to a more dramatic and persistent slowdown of the defaulting countries in the periphery. As shown in Figure 3, growth declines by up to 5 percentage points around the onset of systemic crises, while the decline does not even reach 3 percentage points during defaults triggered by home-grown problems. Furthermore, the contractions are far more persistent around systemic crises.
The collapse in international liquidity and sharp slowdown following the crises in the financial centers not only trigger defaults in the periphery but also tend to prolong default spells and lead to larger investors’ losses when the debt in default is finally restructured. On average, systemic crises tend to last an extra 3 years, and, when they end, investors’ losses are about 22 percentage points higher than those following idiosyncratic crises. Our results also indicate that a quick resolution of systemic crises requires not just the end of the bust in international liquidity but also economic recoveries.
We should not ignore the lessons from the past. The Euro Debt Crisis is not just any crisis. As in the crises in the 19th and early 20th centuries with the financial center at its epicenter, the extent of the economic malaise in this crisis is global. Policy responses should address these widespread economic woes.
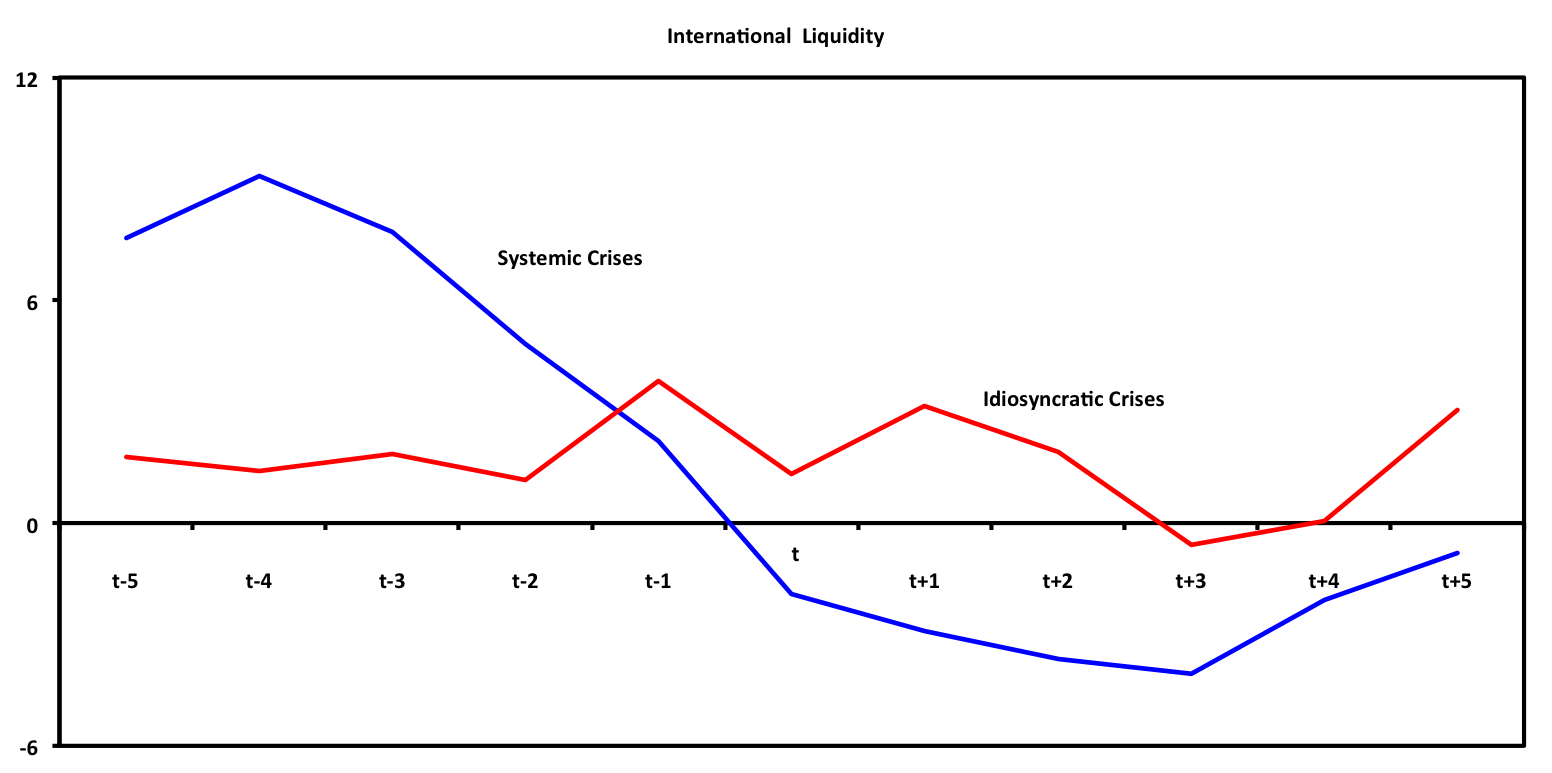
Figure 1: International liquidity is captured with international issuance of countries with high participation in international capital markets, not including Latin American countries. We scale international issuance with a measure of the evolution of the world economy, captured with exports of the United Kingdom
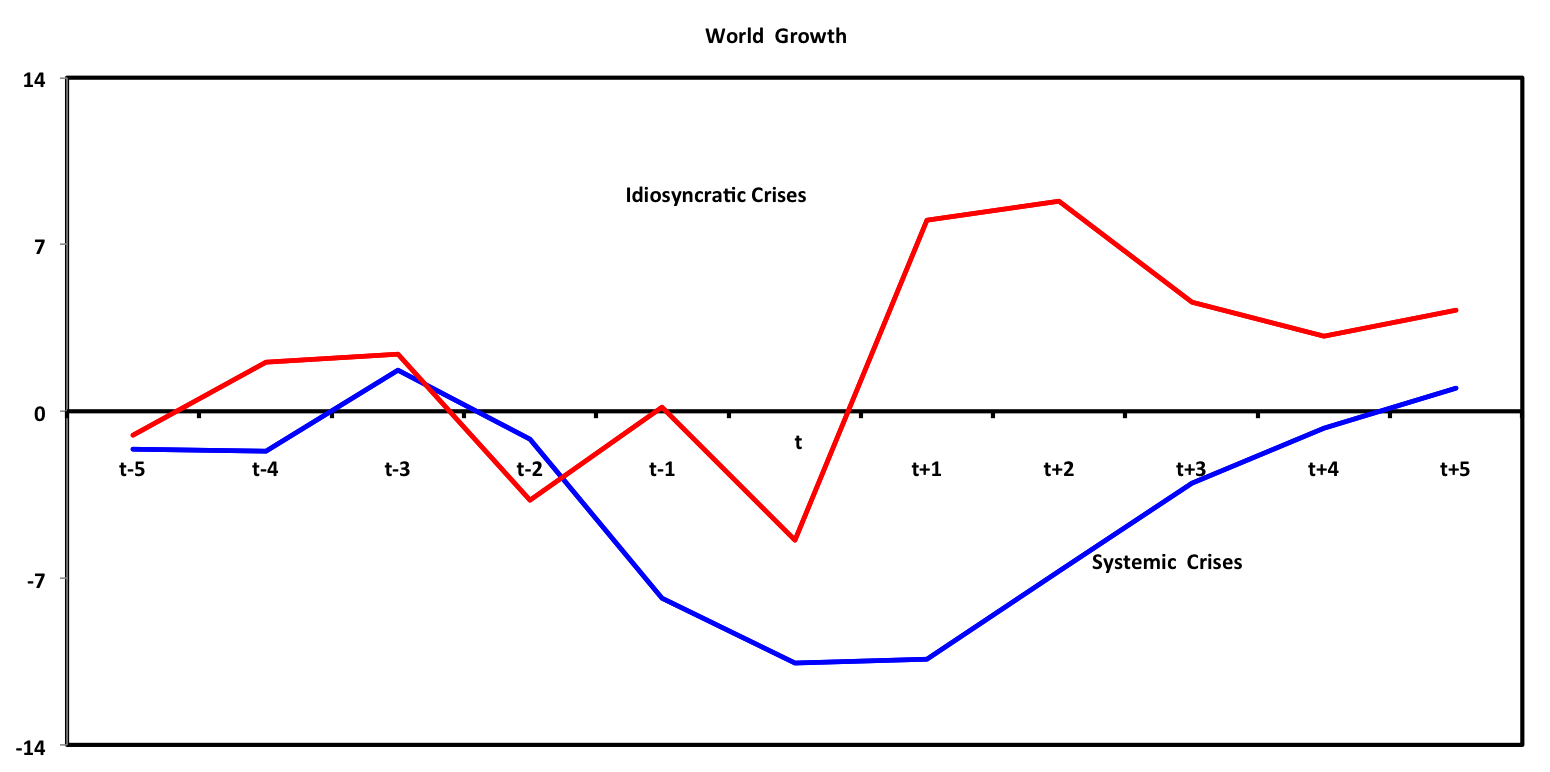
Figure 2: World growth is captured with nominal imports of France, the United Kingdom, and the United States.
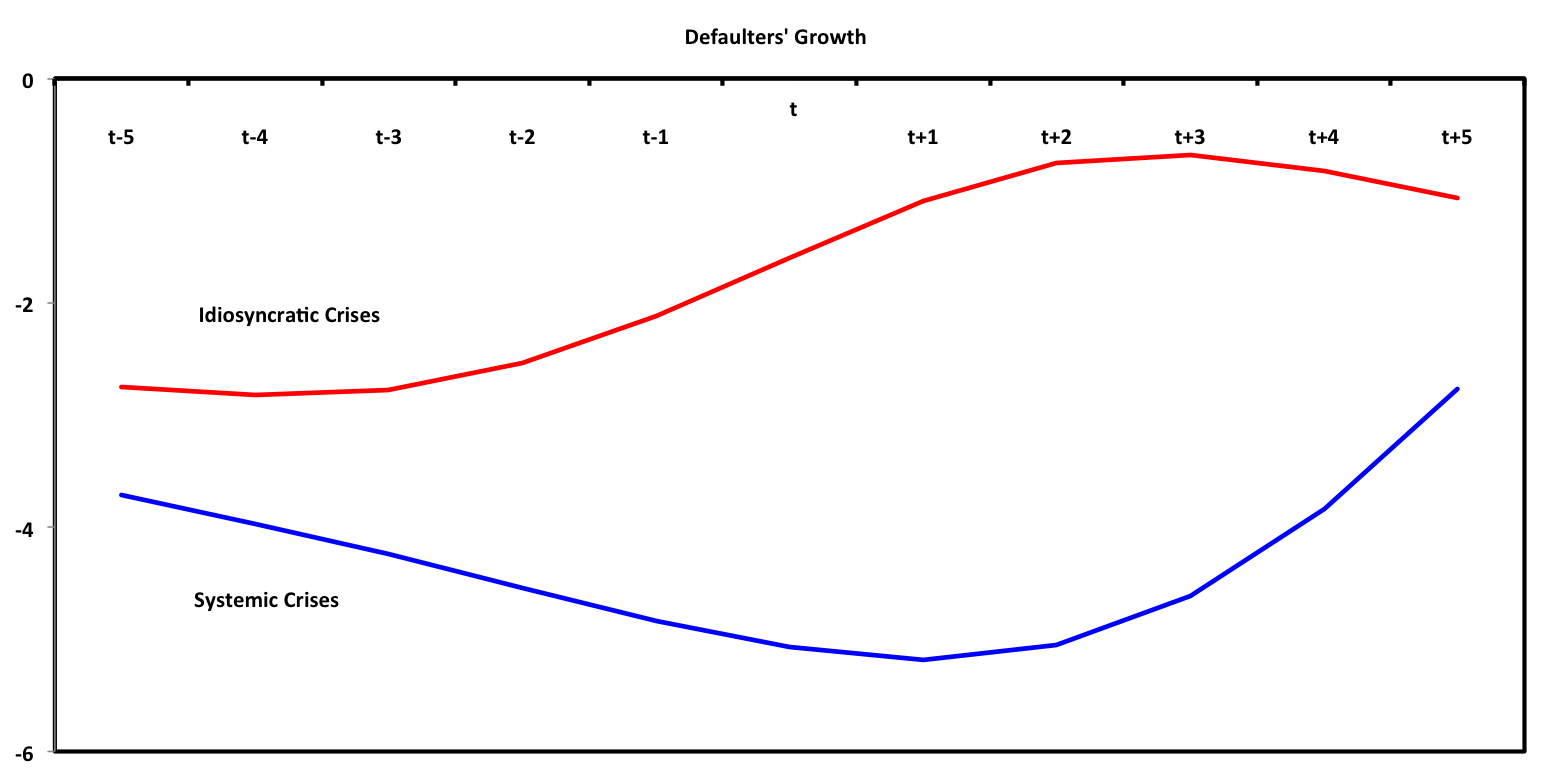
Figure 3: Shows the average growth around sovereign crises relative to growth during non-crisis times. We use growth of defaulting countries’ nominal exports to capture both the evolution of growth of the real economy and of prices.