
The McKinsey report’s highlighting of an extremely high job vacancy ratio in recent years does not reflect the true state of the U.S. labor market.
Every so often a publication comes along that more or less perfectly captures the Zeitgeist of world business elites. So it was on the 26th of June when the McKinsey Global Institute issued a new report: “Help Wanted: Charting the Challenge of Tight Labor Markets in Advanced Economies.”
The message its few pages of charts and text deliver is dire indeed: “Labor markets in advanced economies today are among the tightest in two decades, not merely a pandemic-induced blip but rather a long-term trend that may continue as workforces age.”
This constraining labor market, the report claims, “means forgone economic output,” since employers are not able to “fill their excess job vacancies.” “Companies and economies,” the authors warn, “will need to boost productivity and find new ways to expand the workforce. Otherwise, they will struggle to exceed—or even match—the relatively muted economic growth of the past decade.”
Less than two weeks later, on July 5, the United States Department of Labor released its “Employment Situation Summary” for the month of June. Lost in a wave of mostly upbeat press coverage were two striking facts utterly incongruent with the McKinsey report’s claims. Firstly, unemployment had risen to its highest point since November 2021: 4.1%. Even more awkwardly, Long Term Unemployment among the unemployed had spiked to 22.2% — more than five percentage points above its February 2023 low of 17.5%.
The measure of unemployment highlighted in the June release is the “narrow” measure, sometimes referred to as “U3.” It excludes many workers who we and many other analysts have long insisted should also be counted, such as discouraged workers and those working part-time because they could not find a full-time position. At no point during the pandemic did that “wider” measure, “U6,” in Labor Department parlance, ever fall below 6.7%. Since July of 2023, it has fitfully risen to 7.4. This means that, in June 2024, there are more than 13.1 million American workers willing to work but without a job.
These data are for the United States, but the situation in other developed countries is comparable; indeed, in many countries, the numbers are even more adverse to the McKinsey view. The authors of the report acknowledge that labor markets in some big countries, such as France and Italy, are not very tight, but they minimize the discrepancies, claiming that those are in fact tightening, too, just more slowly.
Rates of unemployment across developed countries differ and bounce around, as one might expect. But the June OECD figures (mostly reporting figures for April that OECD tries to make as comparable as possible), indicate that unemployment rates in most of developed countries run above current US rates and are trending up.
So how does McKinsey justify its conclusion that labor markets are tight and likely endemically so? The answer is simple: It ignores actual unemployment and instead builds its case in terms of data for “job vacancies.”
We have observed before that resorting to data about job vacancies became popular among mainstream economists as the much-touted Phillips Curve relation between unemployment and inflation broke down. And that a close look at US data raises deep doubts about these data’s reliability over time.
The emphasis McKinsey places on these numbers makes it worthwhile to reopen the case, so consider Figure 1. This plots the “job openings rate” and the “quits rate” since the beginning of this century. The first of these is computed by dividing the number of job openings by the sum of employment and job openings; the second refers to the percentage of workers who voluntarily leave their jobs each month. We are interested in the job openings rate because that is closely related to the job vacancy ratio, which is the ratio of job openings to unemployed workers.
Before 2010, the relationship between vacancies and quits was relatively stable. Between 2010 and 2019, however, the job openings rate began to surge relative to the quits rate. During the pandemic the relationship between the two indicators diverged markedly: as job openings rocketed upward, the quits rate remained rather steady.
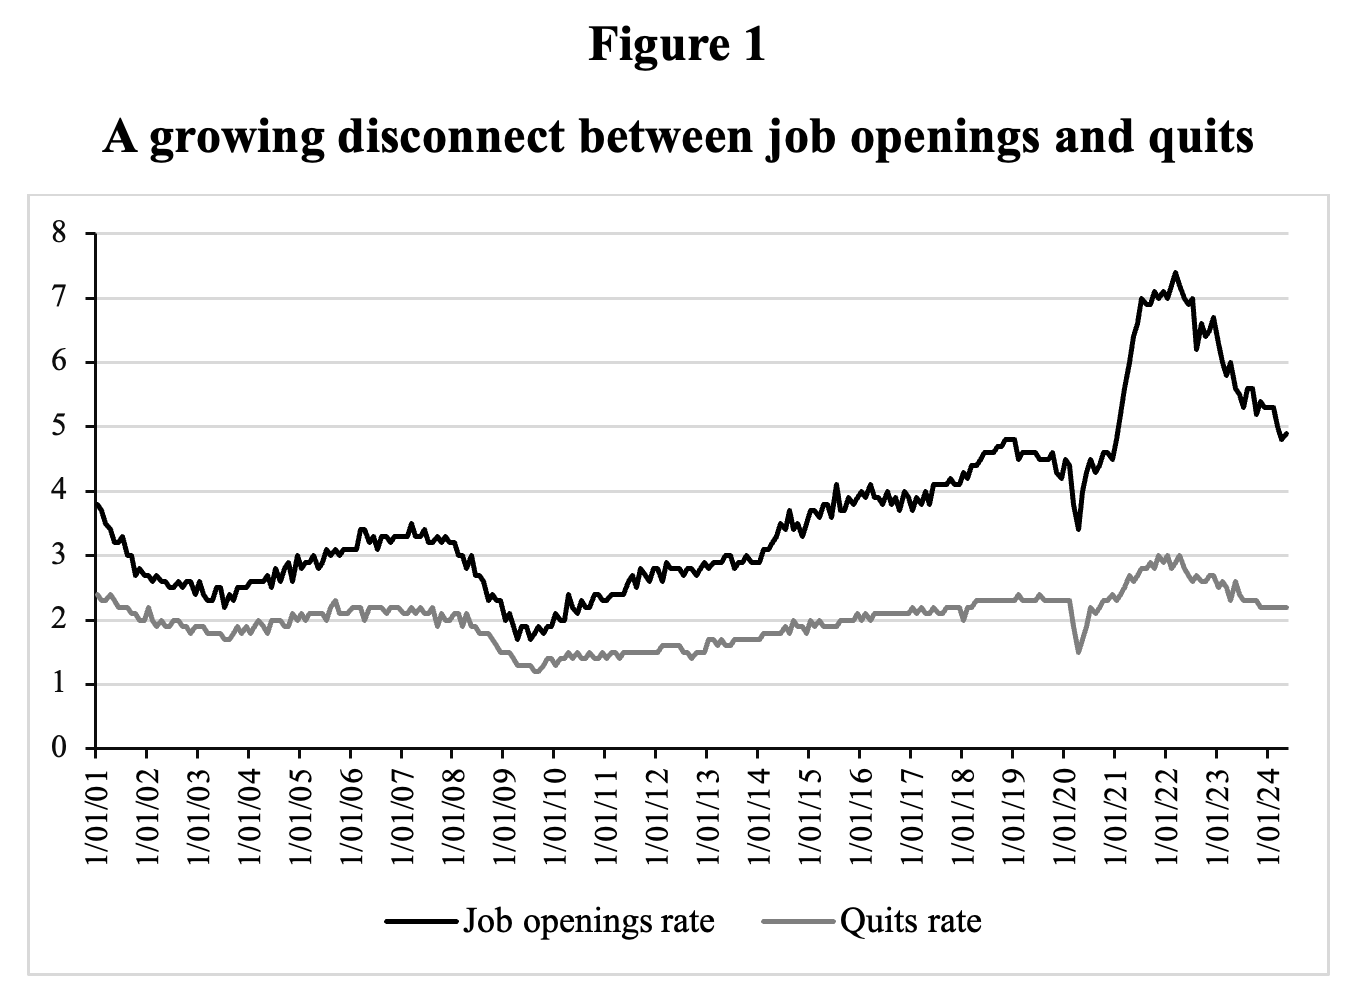
Source: FRED database
Similarly, the job openings rate and the hiring rate have grown apart, as is shown in Figure 2. Both moved closely together from 2001 to early 2020, but then the job openings rate almost doubled, whereas the hiring rate held fairly steady.
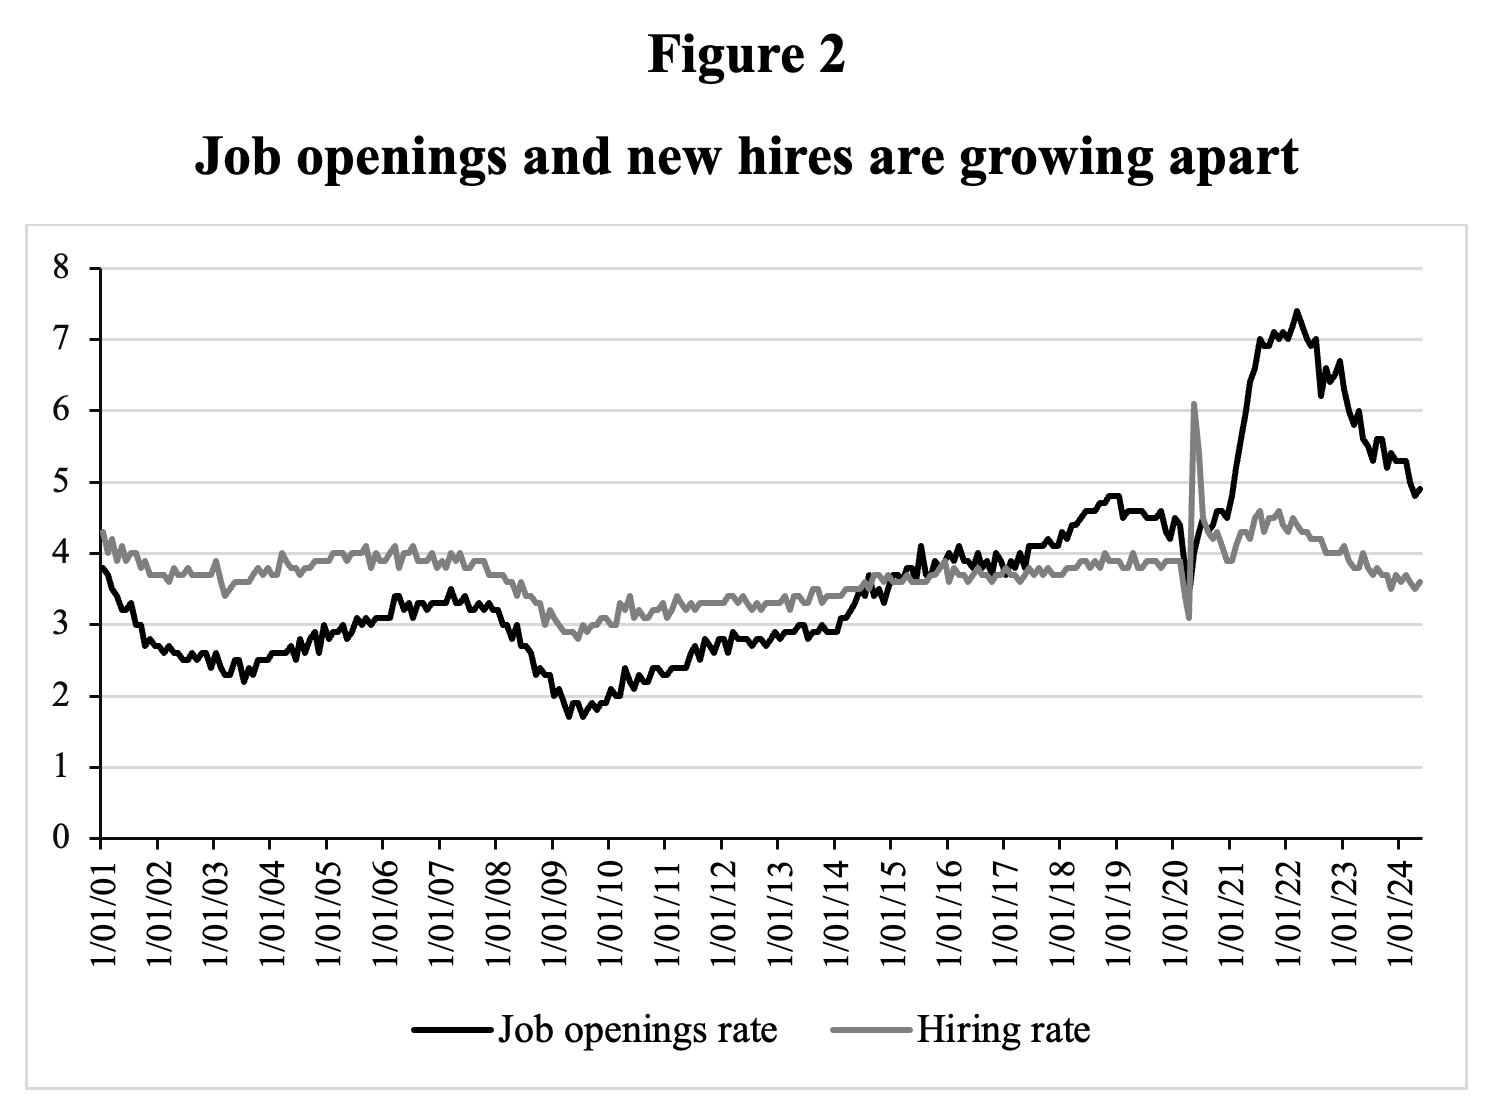
Source: FRED database.
These disparities raise further doubts about the reality of the sudden rise in the number of posted job openings. We could as well have pointed to the job-finding rate of the unemployed or any other labor market measure to show the very exceptional behavior of the job openings rate during 2021-2024.
Figure 3 shows just how unusual the situation was. It presents a “predicted job openings rate,” which we computed assuming that the relatively stable relationships between the job openings rate and the quits rate (Figure 1), and the hiring rate (Figure 2) that existed during January 2001-December 2019 persisted during 2020-2024.[1]
It can be seen that the “predicted job openings rate” closely tracks the actual job openings rate from January 2001 to December 2019, before diverging dramatically from the actual openings rate from January 2021 to May 2024. The “predicted job openings rate” peaks at 5.7% in April 2022, far below the actual peak in job openings of 7.4% of total employment in March 2022. Based on trends in actual quits and actual hires, the “predicted job openings rate” is almost 25% lower than the recorded peak job openings rate.

Source: Authors’ estimations based on FRED database. Note that the predicted job opening rates for the twelve months of 2020 are not included.
It is clear that during the pandemic the behavior of the recorded job openings rate has been anomalous relative to other conventional indicators of labor market activity. This should have raised at least a yellow flag for McKinsey and other economic analysts. Focusing on one anomalous indicator while ignoring contradictory evidence amounts to (inadvertent) cherry-picking.
To put the final nail into the coffin of the vacancy ratio as a serious index, consider Figure 4, in which we plot the unemployment gap against the official job vacancy ratio. Again, it is clear that the sharply elevated vacancy ratios during 2021-2023 do not correspond to a considerably tighter U.S. labor market as measured by a more strongly negative employment gap.
Federal Reserve economists Mongey and Horwich (2023) have noted this anomaly as well, pointing out that the data on U.S. job openings have become disconnected from other indicators, seriously complicating the labor market outlook.
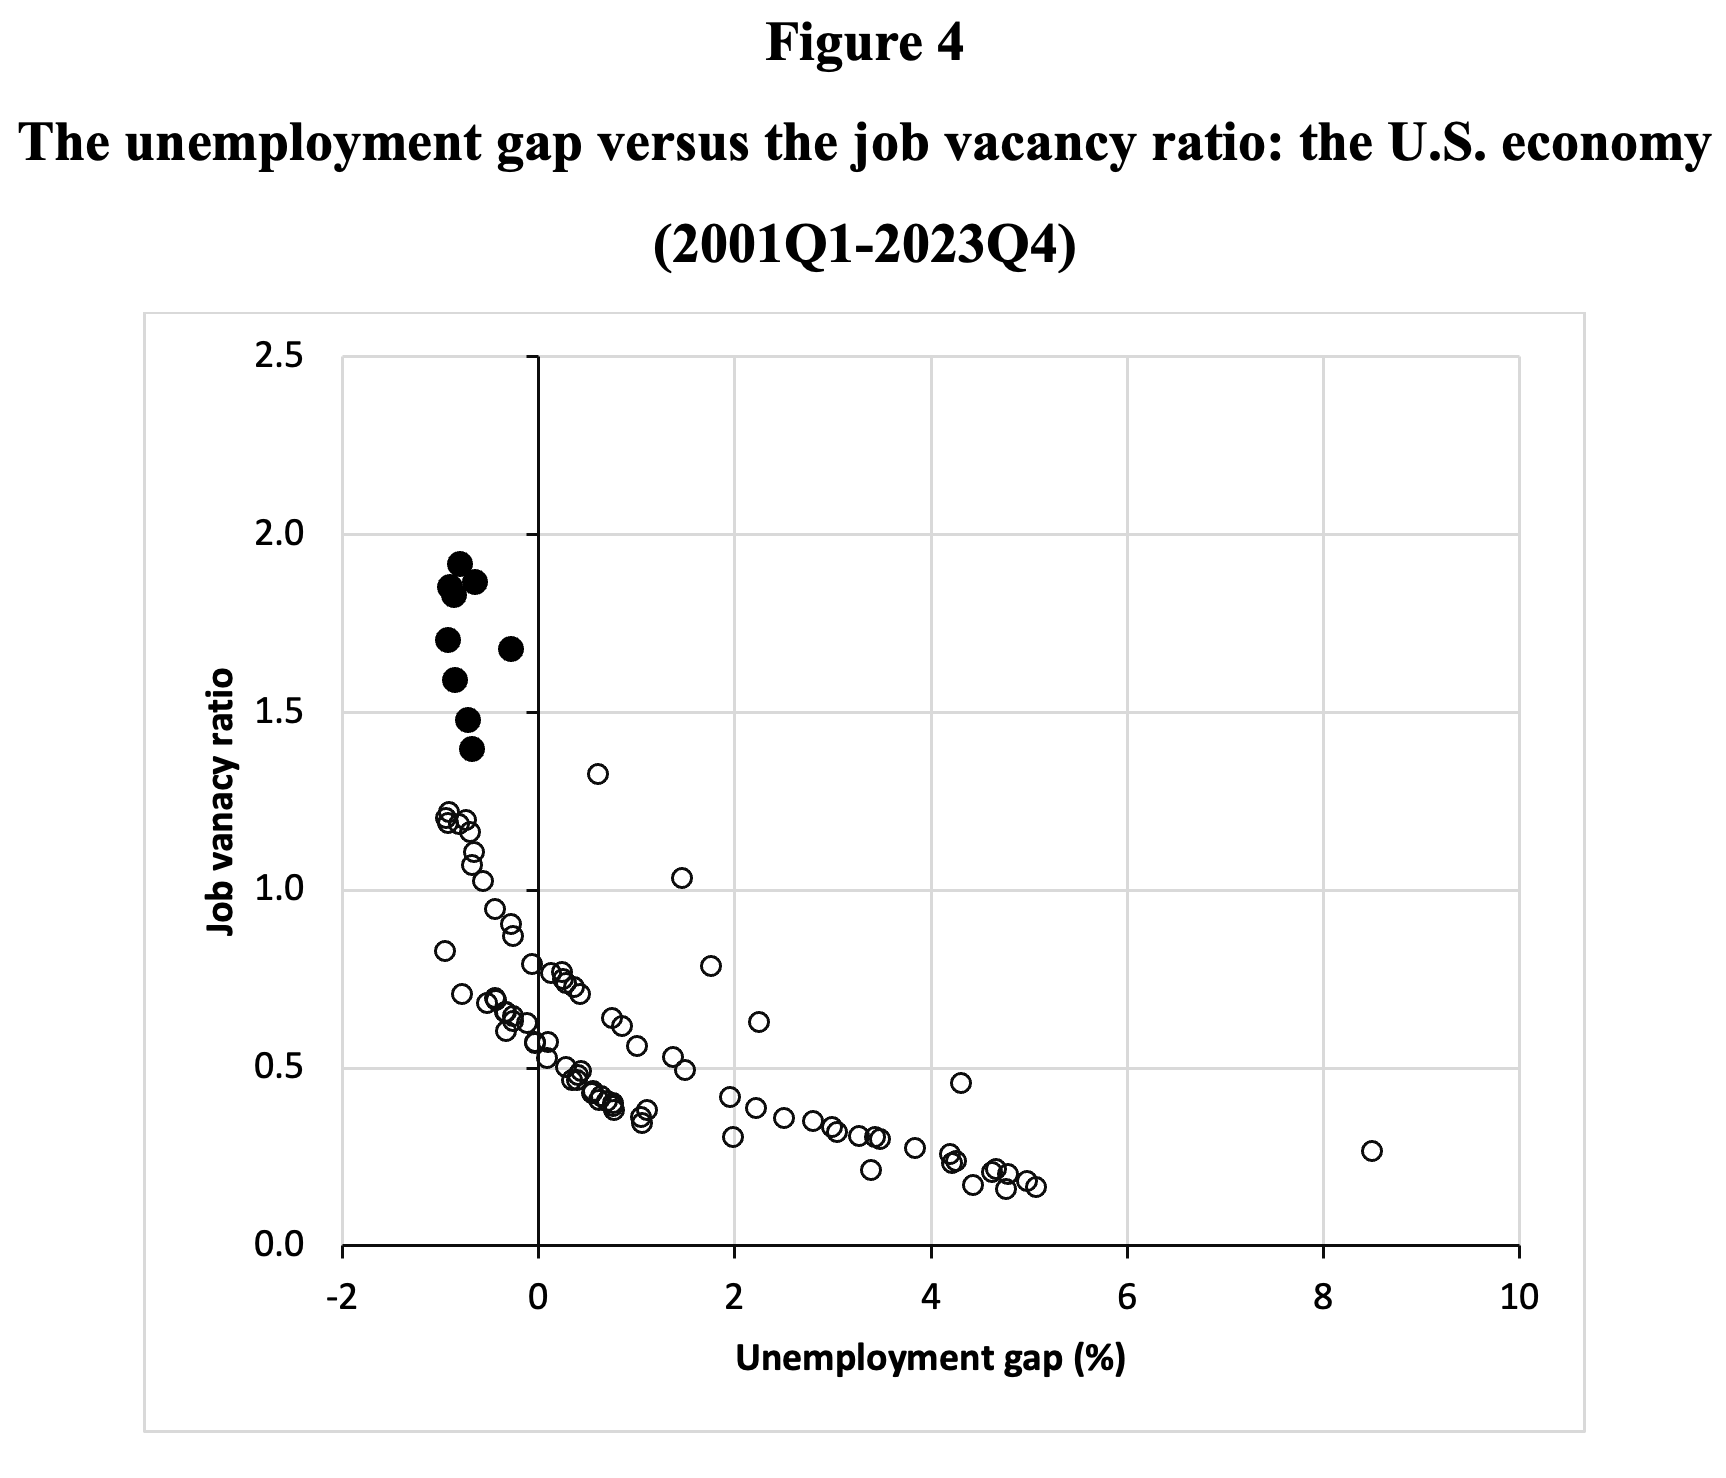
Source: Calculated based on FRED database (series UNEMPLOY; LMJVTTUVUSM647S; UNRATE; NROU). The black dots indicate the observations for the most recent quarters 2021Q4 – 2023Q4, during which the PCE inflation rate increased sharply. The unemployment gap is measured as the percentage point difference between the actual unemployment rate and the NAIRU (as estimated by the CBO).
One plausible factor in skewing the job openings rate (and the vacancy ratio) is that digital technologies have dramatically lowered the cost to employers of job posting, recruiting, and evaluating candidates. As firms have become familiar with using the internet, they have begun experimenting with strategic uses of their newfound powers. Over time, the result has been an increase in dubious postings.
In the U.S., the basic data come from Labor Department surveys. The surveys require that firms are actually advertising for work and that a real position exists that could be filled within 30 days. While research into this area has only begun, some conclusions seem relatively safe. Firstly, some decay in data quality could be innocent. For example, notices for job posts may remain on the internet after they have been filled or the search has been canceled, sometimes for long periods. Some firms also post external job notices for positions they actually intend to fill internally.
Secondly, efforts to scam job seekers by outsiders manipulating other firms’ posts is enough of a problem that researchers are now investigating how artificial intelligence methods might be used to defend against them. For this, the firms themselves can hardly be blamed.[2]
However, recent survey evidence suggests that many firms now advertise positions with no intention of any imminent hiring. Such information allows them to track the replacement cost of their current workforce in real-time and remind current employees that they could be dispensed with. “In some instances, hiring managers said their goal is to signal to current employees they are replaceable. Nearly 60% of companies surveyed said they collected resumes to keep them on file for a later date, with no intention of immediately hiring anyone.” Analysts familiar with company practices also suggest that being able to point to a notice unfilled for a long time can sometimes help companies make special cases for particular employees they want to hire, particularly if they need visas.
Estimating the percentage of faux ads is hardly an exact science, but evidence suggests that they increased slowly in the years before the pandemic, then shot up dramatically once COVID hit. The practice is now common enough to raise hackles among job seekers (and their counselors) who applied for positions they believed were offered in good faith.
The McKinsey study treats these data with no sense of their fragility. It takes no account of faux positions or their likely seismic increase once COVID hit. It simply displays a rising plot of vacancies in the United States and other major countries. We think it is worthless as evidence about the real state of labor markets, as Figures 1 to 4 have already shown.
Even on its own terms, though, the data can hardly qualify as serious evidence. Time series analysis is notoriously a black art and disentangling real trends from noise is a perennial challenge. The McKinsey study’s time series just doesn’t make the grade. The study plots observations from 2015. If you extend the jobs to vacancy data back to 1970, as we do in Figure 5, there is no evident trend in the data. The job vacancy ratio has shot up repeatedly over time, for instance during 1997-2000 and during 2017-2019, but also dropped off repeatedly to levels below its long-run average.
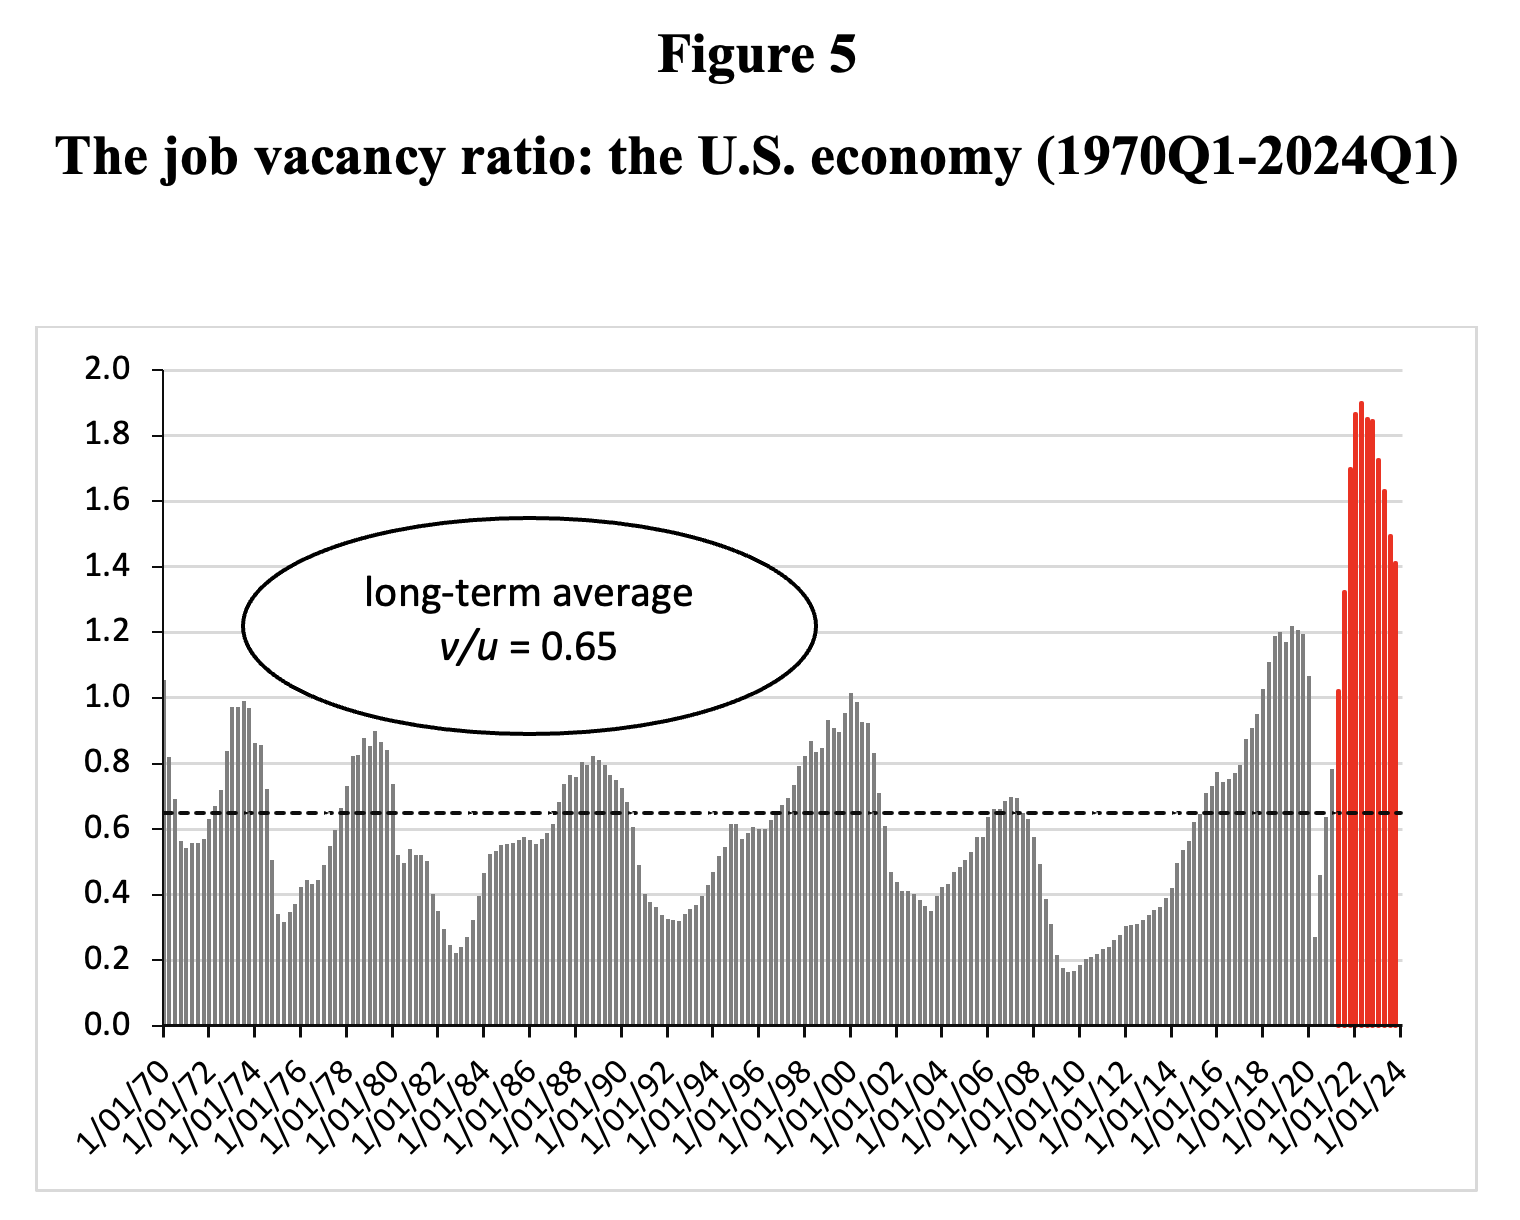
Sources: Calculated based on FRED database (series JTSJOL and UNEMPLOY) and Barnichon (2010). Notes: The data for 1970Q1-2000Q4 were constructed by Barnichon (2010). The job vacancy ratio is the number of vacancies per unemployed worker.
A final piece of evidence confirms that the extremely high vacancy ratio in recent years did not reflect the true state of the U.S. labor market. Figures 6 and 7 display this evidence. Figure 6 scatterplots the job vacancy ratio against nominal wage growth during 1970Q1-2023Q4. It is obvious that the extremely elevated vacancy ratios of recent times did not lead to exceptionally high nominal wage growth, as we have emphasized in several previous studies that have critically analyzed highly advertised claims to the contrary. Rather the opposite: nominal wage growth during 2021-2023 was close to the long-term average.

Sources: Calculated based on FRED database (series JTSJOL, UNEMPLOY and PRS85006101) and Barnichon (2010). Note: quarterly nominal wage growth is measured by the growth rate of hourly compensation for all workers in the non-farm business sector.
Figure 7 plots the job vacancy ratio against the growth of real average hourly earnings during 2001Q1-2023Q4. It is again apparent that the unprecedentedly high job vacancy ratios did not lead to high real wage growth. On the contrary, the growth rates of real average hourly earnings were negative, right when the vacancy ratio was at its highest level.
There is no doubt that the rise in the job vacancy ratio is spurious, i.e., not related to real labor-market tightness, but instead most likely caused by a sharp increase in manipulative job postings.

Sources: Calculated based on FRED database (series JTSJOL and UNEMPLOY) and Barnichon (2010). Notes: The data for 1970Q1-2000Q4 were constructed by Barnichon (2010). The job vacancy ratio is the number of vacancies per unemployed worker.
McKinsey, finally, makes the laughable point that “at the economy level, we estimate that GDP in 2023 could have been 0.5 to 1.5 percent higher in the biggest advanced economies if employers had been able to fill their job vacancies.” The reason, supposedly, is that “companies may need to turn down orders because they can’t hire enough workers to satisfy demand.”
McKinsey assumes that labor scarcity is constraining output: firms cannot step up production because they cannot fill their job vacancies. This can only be true if there really is a lack of workers. According to McKinsey, the U.S. suffers from a labor shortage, because the number of job vacancies is higher than the number of unemployed workers. We do not need to repeat our arguments, made above, for why the data on job openings have become unreliable and polluted. McKinsey’s claim is wrong for yet another reason, however. The measure of unemployment (called U3) used in the study also does not represent a good indicator of workers without a job.
The reason is that U3 excludes many workers who should also be counted, such as discouraged workers and those working part-time because they could not find a full-time position. While around 6.1 million American workers were unemployed in the year 2023 according to the narrow definition of unemployment, in reality, more than 11.6 million workers were without a job, based on the broader (U6) definition of unemployment. As is shown in Figure 8, rather than having a labor shortage, as McKinsey wants us to believe, the U.S. had a sizeable labor surplus of more than 2.3 million workers in 2023 – when compared to the flawed and polluted count of job openings. Given the “inflated” number of job vacancies, the real labor surplus is still higher. All this means that McKinsey’s estimate of output foregone due to the misdiagnosed labor shortage is bogus.

Sources: McKinsey (2024); the alternative labor surplus measure is estimated using data from FRED on “Total Unemployed, Plus All Persons Marginally Attached to the Labor Force, Plus Total Employed Part Time for Economic Reasons, as a Percent of the Civilian Labor Force Plus All Persons Marginally Attached to the Labor Force (U-6)”.
These are not the only difficulties we see with the McKinsey report, especially in light of the vast changeover to electric vehicles now underway in the world automobile industry. This will likely reduce employment in both the US and Europe. Other “hidden labor reserves” also exist in Europe and the US. The McKinsey report itself notes that reasonable cost daycare could allow many more parents, mostly women, to participate much more fully in the labor force. We also doubt very much that the aging of the workforce explains nearly as much about recent labor market participation as often claimed, though that topic is so important it will have to be reserved for another occasion. And there are steady streams of immigrants, now apparently undercounted in the United States by several million. Claims of a coming labor shortage just do not hold water. The real place where “help wanted” signs should be posted is for better estimates of job vacancies.
Notes
[1] Technically, we performed a simple Ordinary Least Squares regression of the job openings rate as a function of the hiring rate and the quits rates (using monthly data for the period December 2000-December 2019; n= 229).
[2] Some of these problems and others not mentioned here, such as multiple listings of the same position, are well understood and serious efforts to track positions typically try to take account of them.